Sample report
A fence company, graded end to end
A complete StashGrade readout, exactly as the dashboard shows it. This is Birchwood Fence Co., the same company we walk through on a demo call. Nothing is hidden behind a signup.
Birchwood is a demo company with seeded books, not a real customer.
First: the straight answer
One grade for the whole business
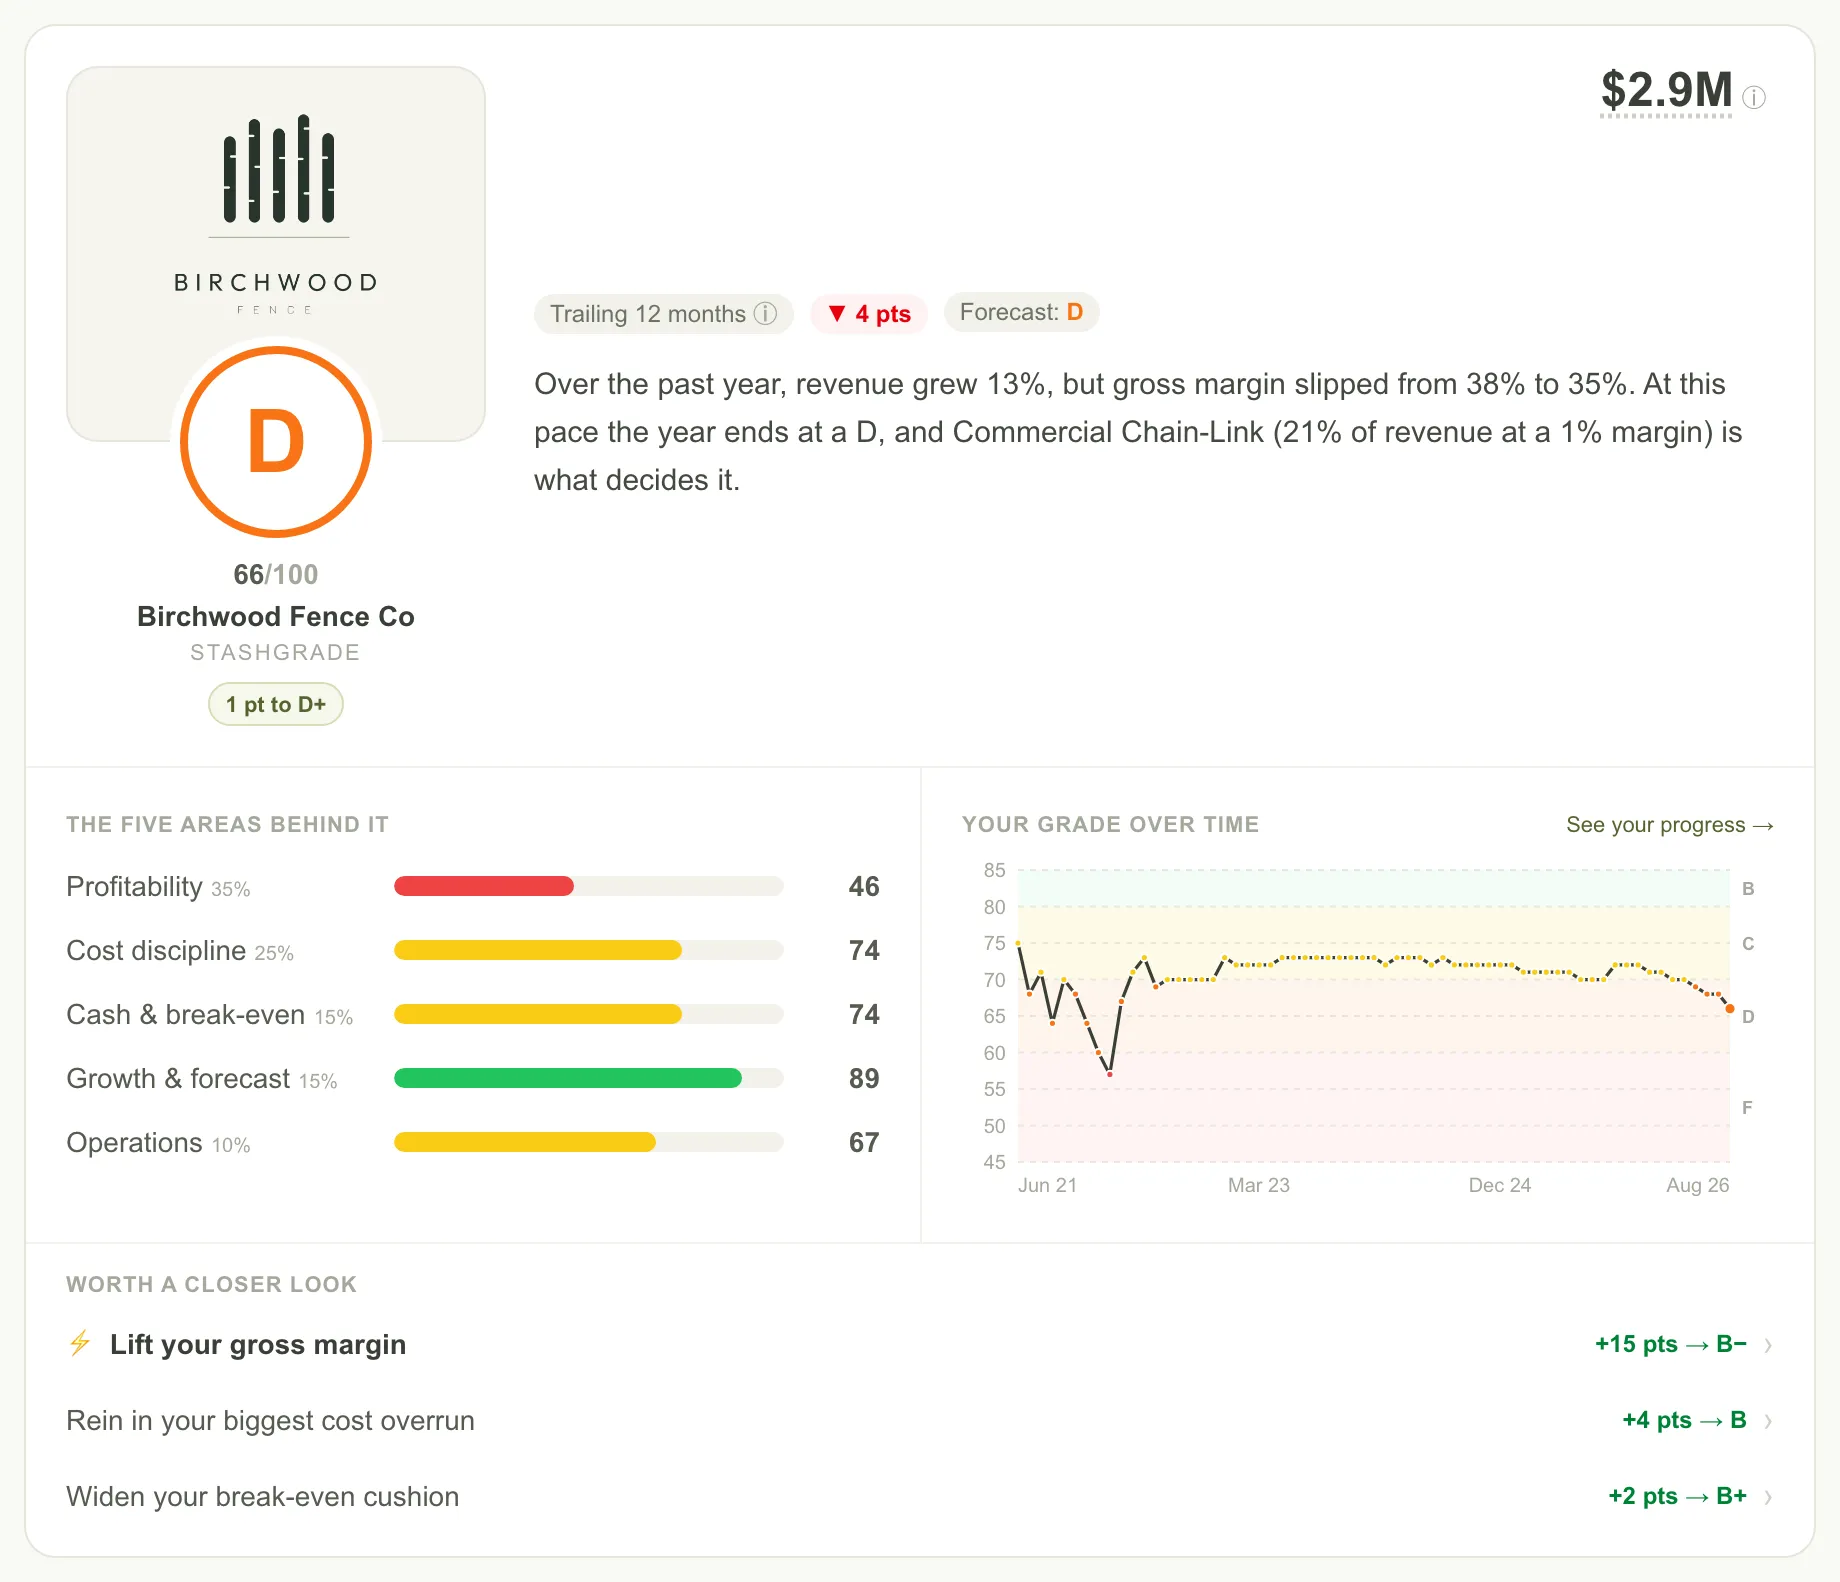
Birchwood grades a D. Profitability is the area dragging it down, and the line beside the grade says why in one sentence: commercial chain-link brings in a fifth of the revenue at almost no margin.
Under the grade sits the move that would raise it the most, priced in points: lift gross margin. Not a report to interpret. An actual next step.
Birchwood's books move every day, like a real company's, so the exact score in the picture will too.
Then: which work actually pays
Margin by fence type, extrapolated from the books
The demo company's chart of accounts does not split revenue by fence type. Almost nobody's does. StashGrade reads what is there and extrapolates the segment split anyway. Here is the readout:
| Segment | Gross margin | Note |
|---|---|---|
| Vinyl / PVC | 55% | best margin, smallest segment |
| Ornamental aluminum | 52% | |
| Cedar / wood privacy | 48% | |
| Repairs & service | 12% | |
| Commercial chain-link | −12% | lost $241K in 2025 |
The owner of this company saw a healthy 30% blended margin. The readout shows commercial chain-link losing money on every job while vinyl carries the company. That is the finding the blended number was hiding.
The number that lies
Your blended margin hides the loser
One company-wide number looks fine, so you keep bidding the same way. Split it by job type and the average turns out to be winners carrying a line that bleeds on every job.
What your books show
30%
company gross margin
Looks fine
What StashGrade sees
Commercial chain-link lost money on every job. The blended 30% hid it.
Then: the money leaks
The charges nobody was watching
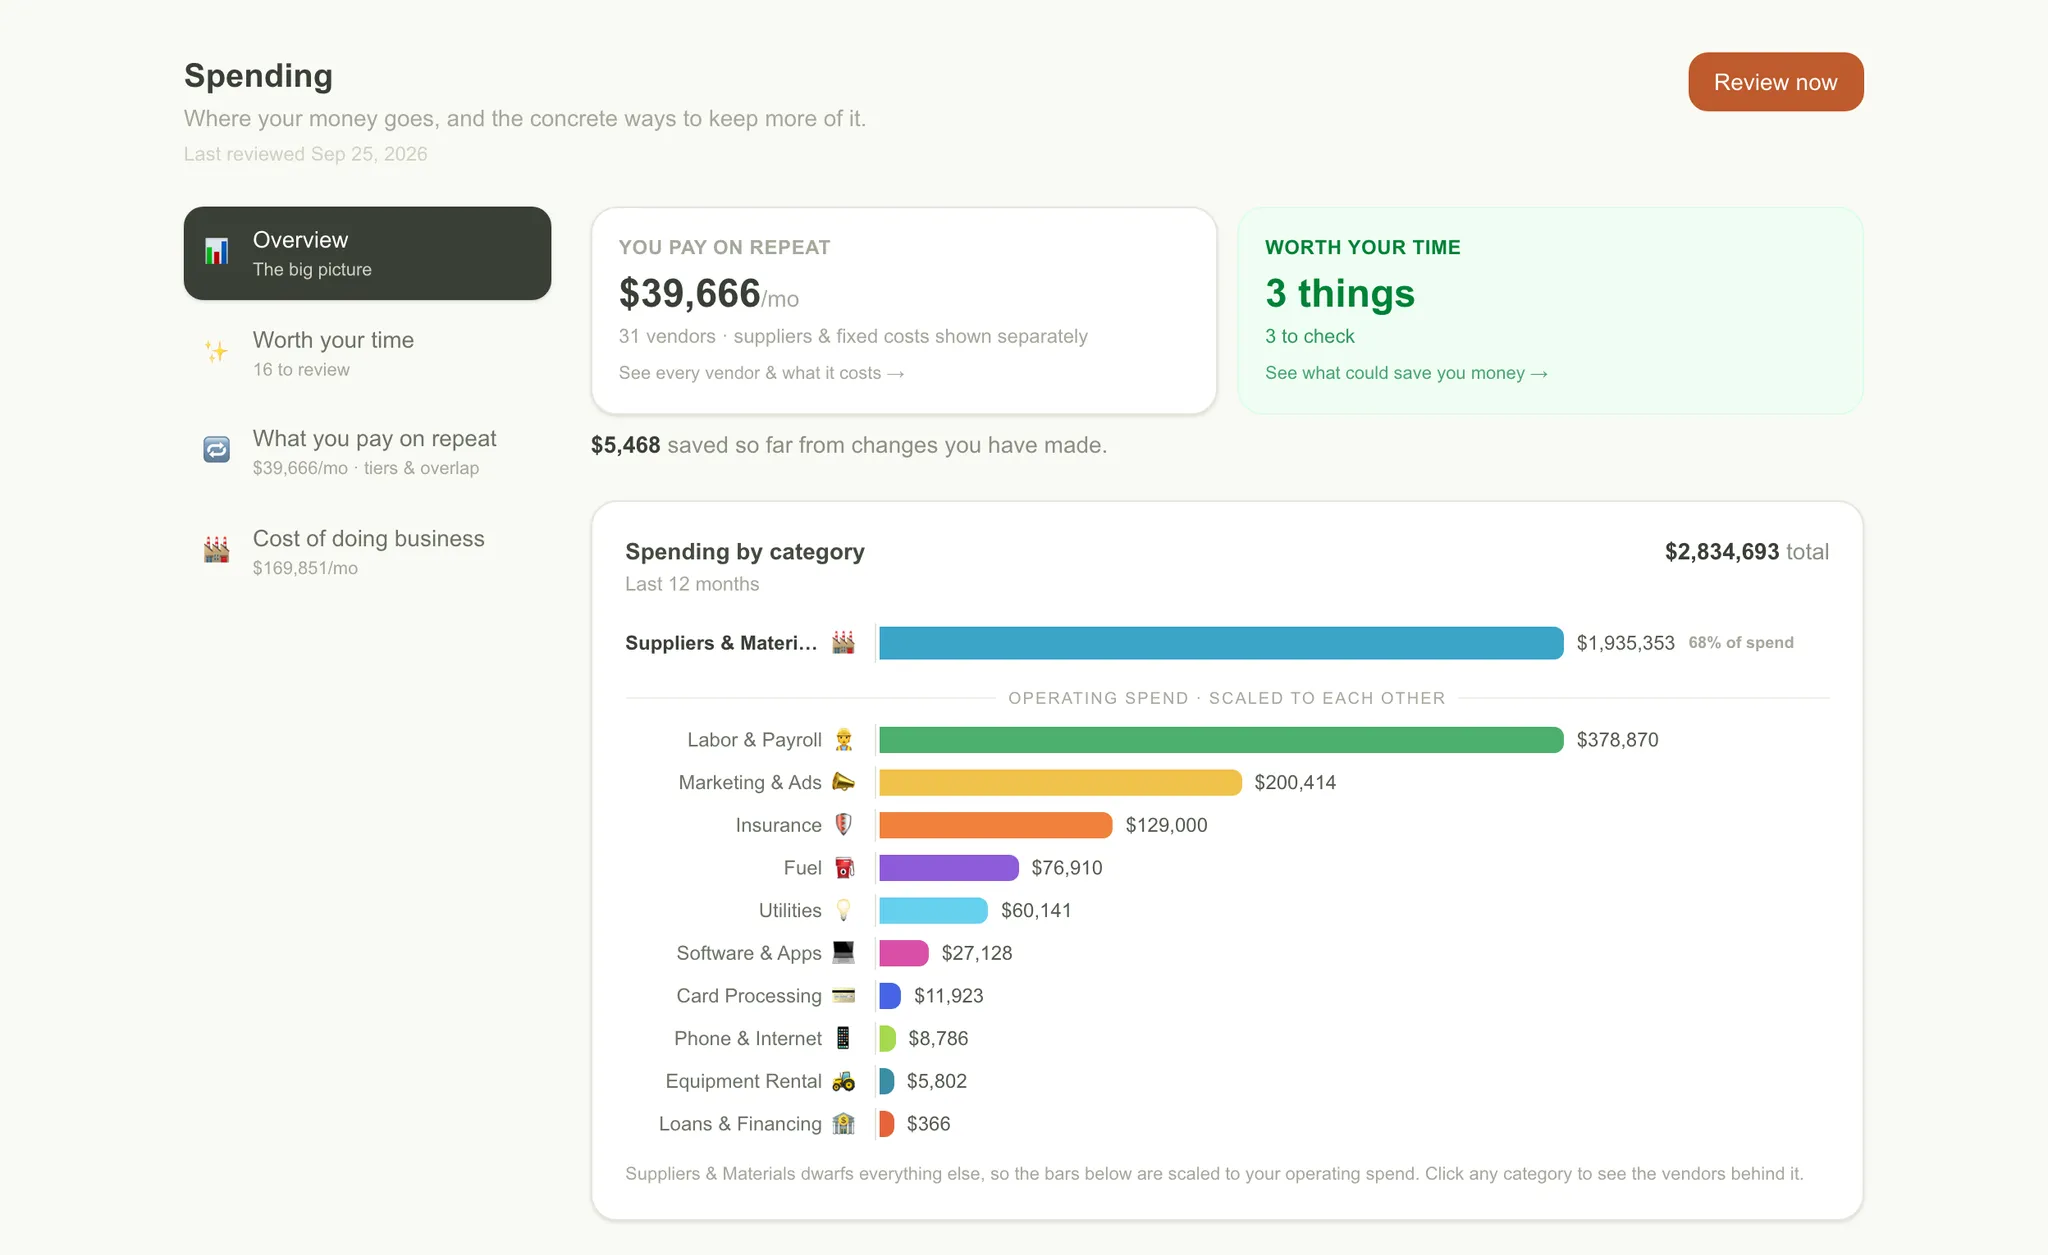
Every dollar sorted by what it paid for, the vendors paid on repeat, and a short list worth your time: a rate that crept up, two vendors doing one job, a bill entered twice. Each finding links to the exact transaction, so the fix is a phone call, not a forensic project.
Then: where every dollar went
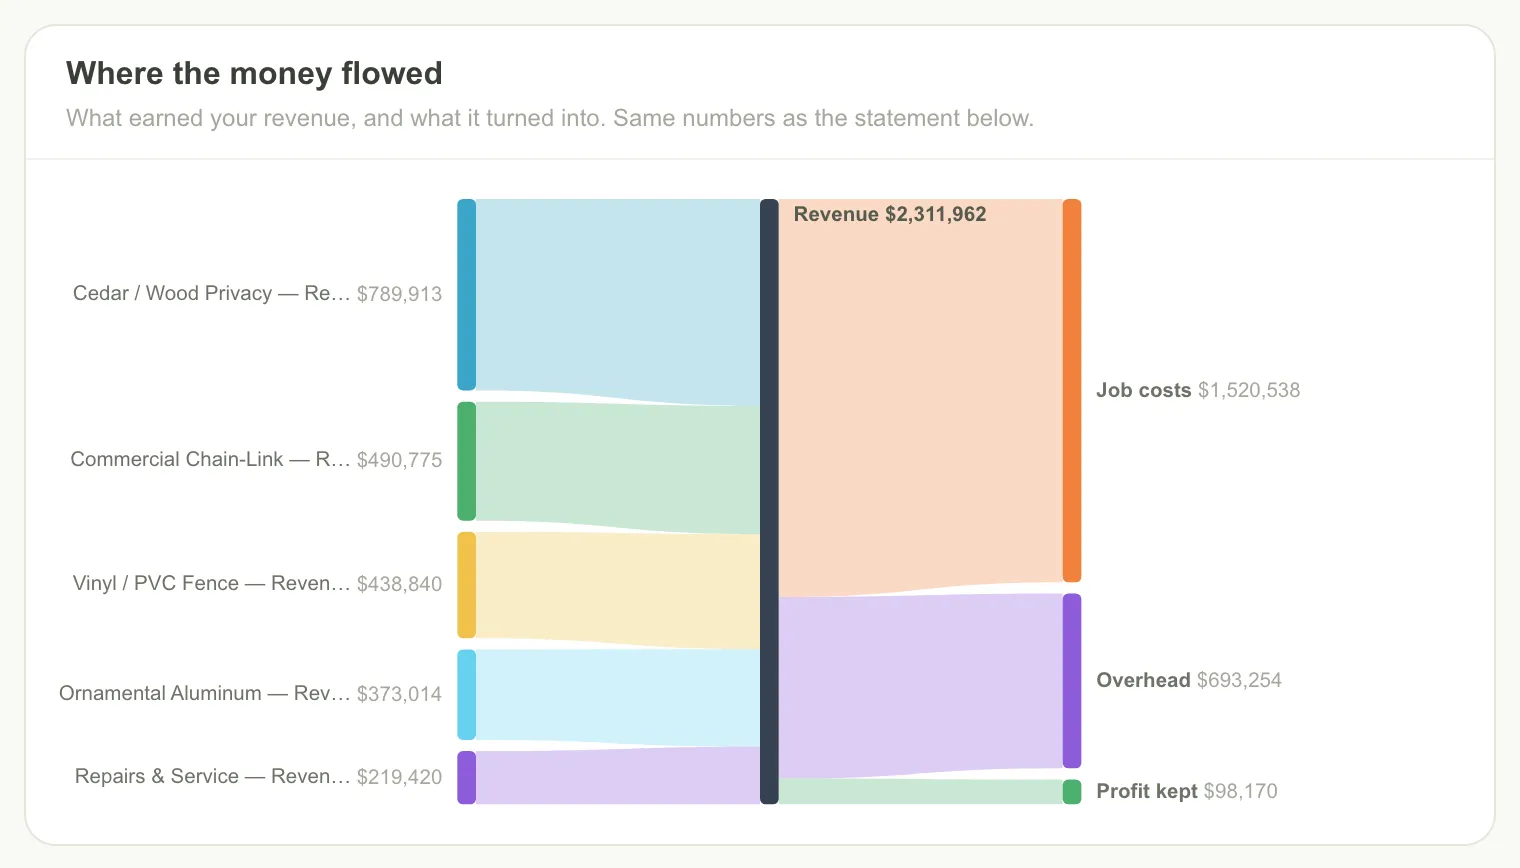
Revenue in, job costs and overhead out
The same P&L your accountant reads, drawn as a flow. You can see what each product line brought in and what was left after the crew and the office were paid.
And: what it would be worth
A valuation range from the same books
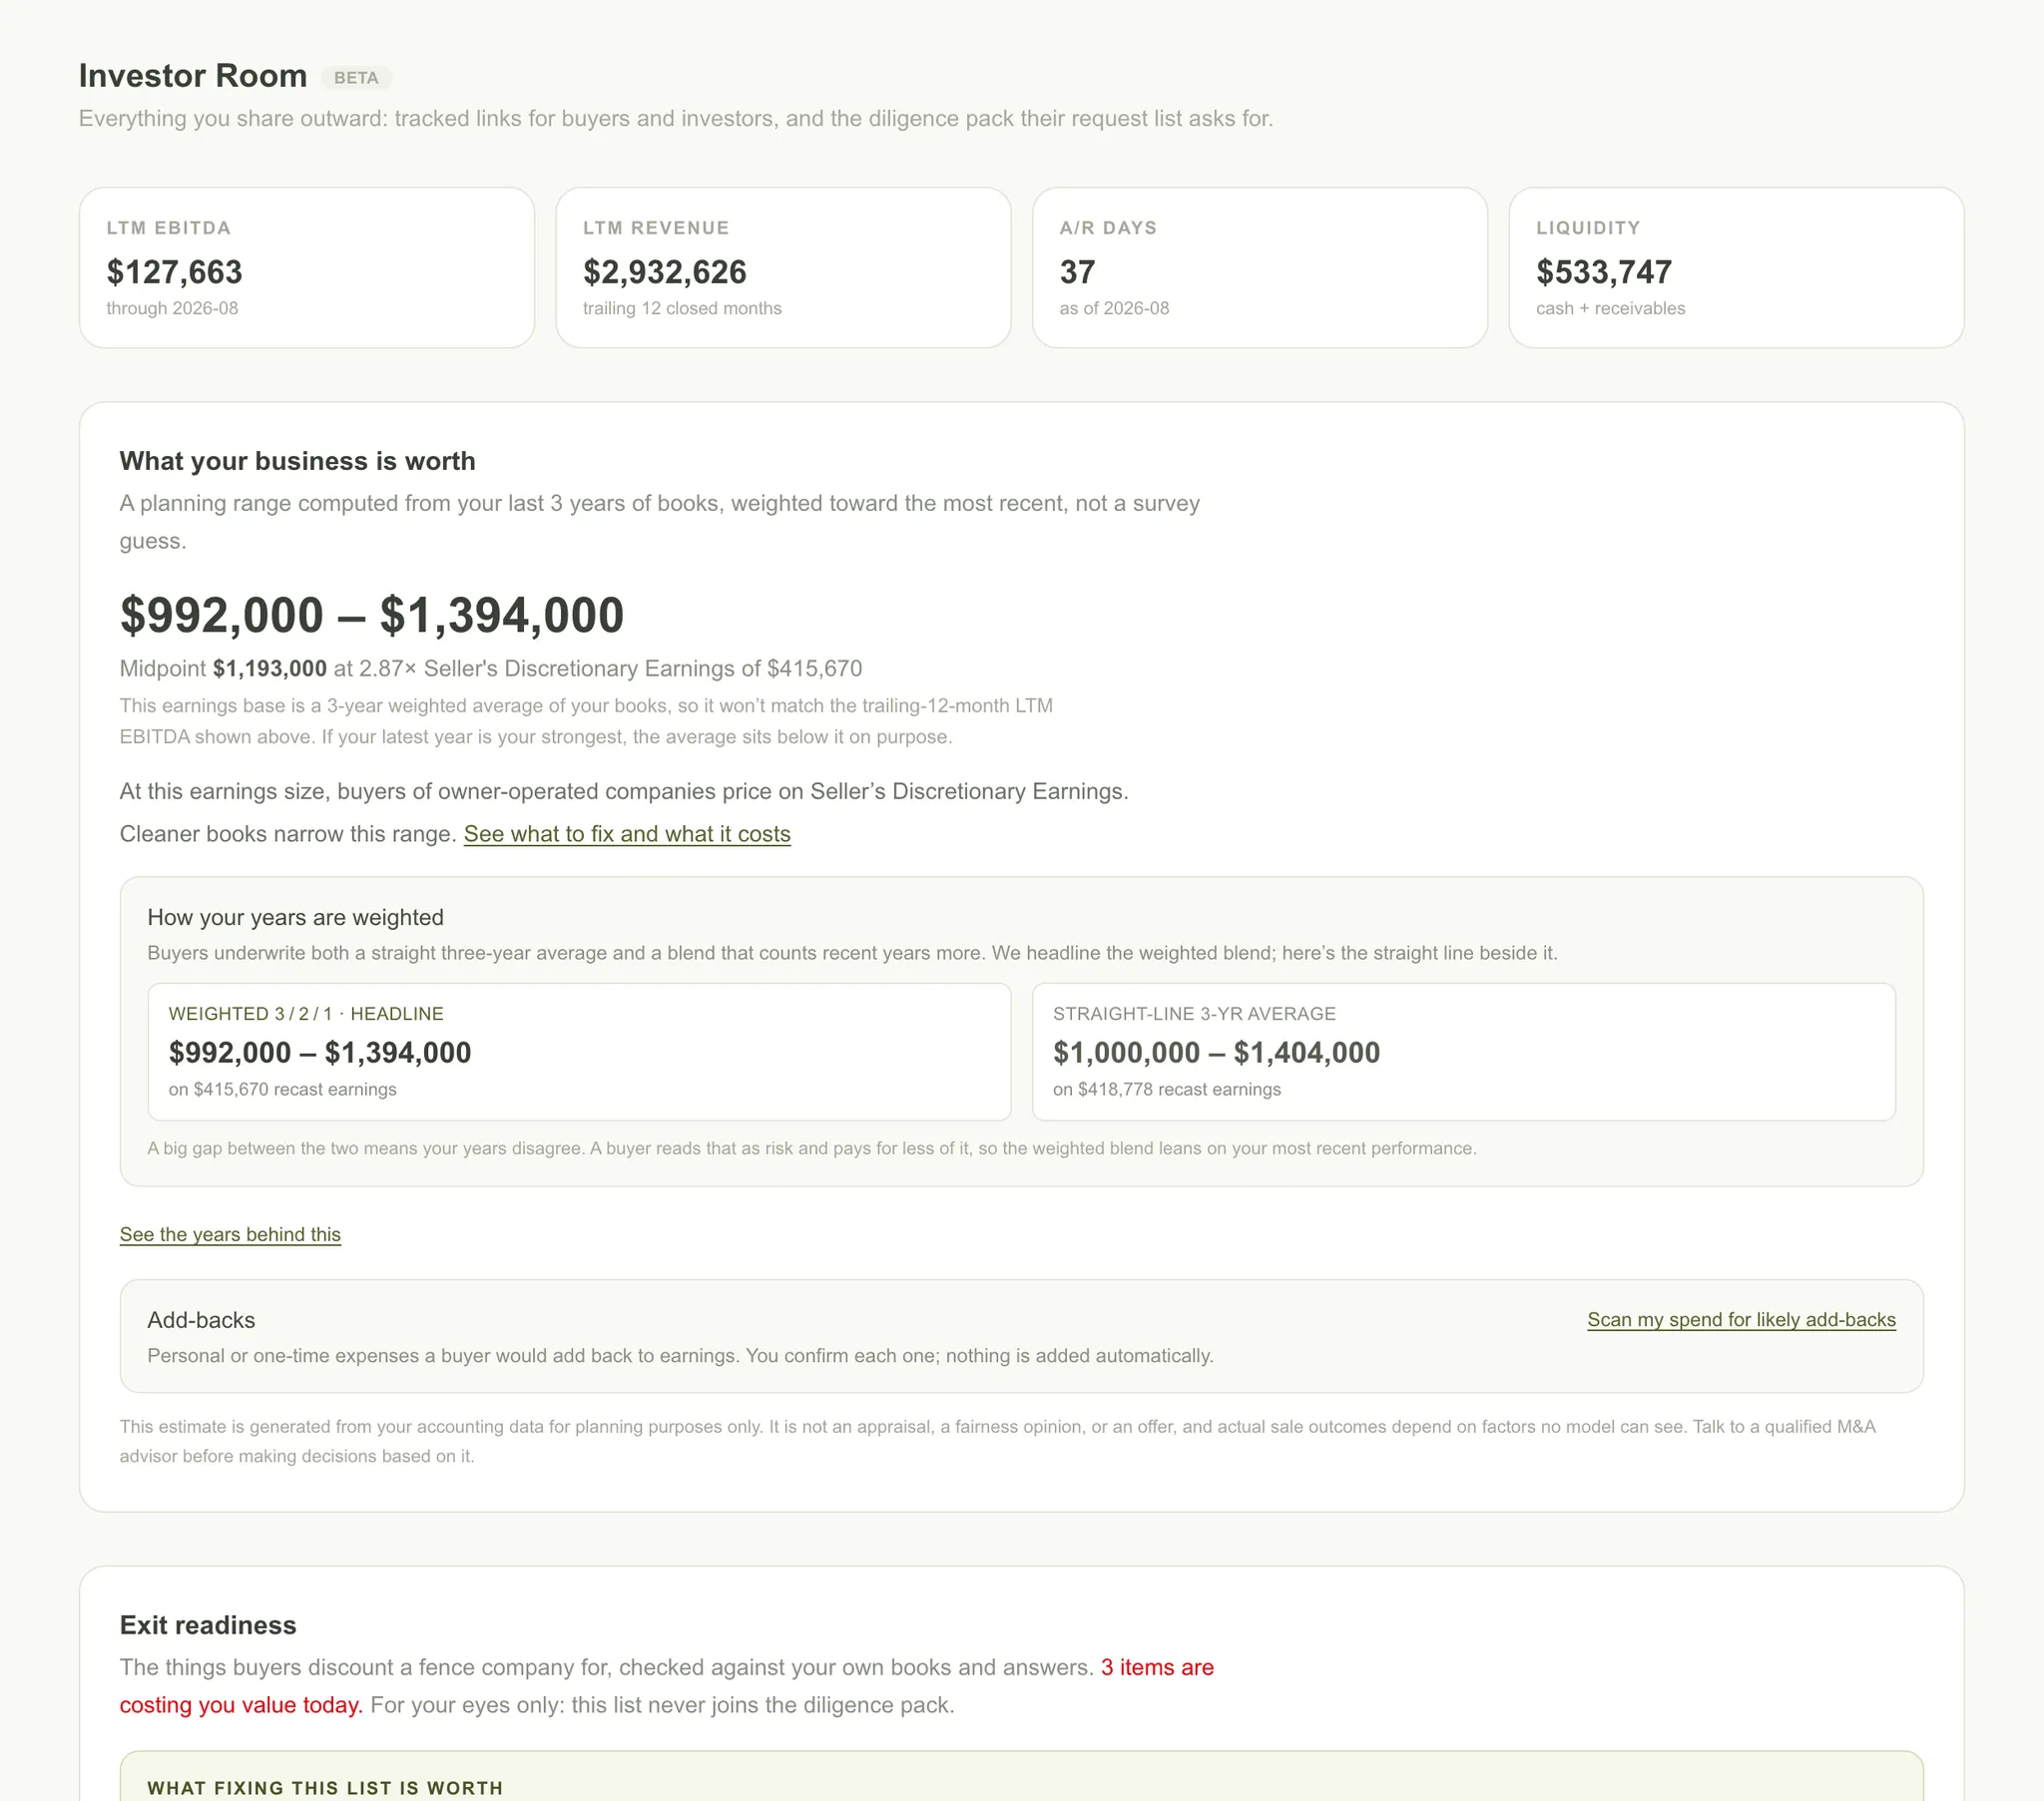
The Investor Room turns the readout above into a planning range, weighted toward recent years, with the add-backs listed one at a time.
For planning purposes only. This is not an appraisal.
Finally: the plan
A CFO and a coach who already read the books
The advisor takes the findings above and turns them into a sequence: chase the aged invoices first, reprice the losing segment second, cancel the duplicate charges today. Ask it anything about the numbers and it answers from the actual books.
What's the single biggest lever for me this quarter?
Collections, by a mile. Your margins are fine, so do not touch pricing yet. Tightening terms and chasing the oldest invoices frees about $90K of cash and moves your grade to A−. Here is the order to work it.
Now run it on your books
Connect QuickBooks, upload a CSV, or export from your job software. Your version of this report takes about five minutes, and the free plan covers it.
Read-only. No credit card. Messy books welcome.
Or open Birchwood’s live dashboard, the sample company behind this report: see the sample dashboard →